What we know about the measurement:
- Quality of the measurement data is
low.
-
Origin of the data is Perlisten.
-
Format of the data is
a scanned image
.
-
-3dB (resp. -6db) point v.s. reference is at 76.0Hz (resp. 55.3Hz).
-
Reference level is normalised to 0.2dB
computed over the frequency range [300.0Hz,
5000.0Hz].
-
Frequency deviation is 1.3dB over the same frequency range.
- Tonality (Preference) Score
- Tonality (Preference) Score is 6.53
and would be 8.54 with a
perfect subwoofer.
- Details:
NBD: ON 0.26,
LW 0.195, SP
0.239, PIR
0.182; SM:
SP0.961,
PIR0.885; LFQ
2.002, LFX 42Hz
- Tonality (Preference) Score is 7.16
with an EQ and would be 8.95 with a
perfect subwoofer and the same EQ.
- Details:
NBD: ON 0.203,
LW 0.135, SP
0.236, PIR
0.14; SM:
SP0.979,
PIR0.946; LFQ 2.002, LFX 37Hz
-
Link to original Review: vendor review.
Links to other reviews: asr review
.
-
Note: Vented measurements provided by Perlisten, note that smoothing is heavy and score will be overestimated.
|
AutomaticEQ (IIR)
|
|
Set preamp gain to: -2.6dB.
|
| Type |
Freq |
Q |
Gain |
| LS |
74.0 |
0.9 |
2.77 |
| PK |
74.0 |
1.16 |
-0.96 |
| PK |
74.0 |
2.22 |
0.8 |
| PK |
113.0 |
0.6 |
-1.21 |
| PK |
565.0 |
2.91 |
-0.83 |
| PK |
817.0 |
2.96 |
0.89 |
| PK |
2153.0 |
2.86 |
0.91 |
| PK |
4202.0 |
1.39 |
0.78 |
| PK |
12662.0 |
0.75 |
-0.66 |
|
Download
|
This EQ optimise the Harman score and is a good start for far field listening like in your living room.
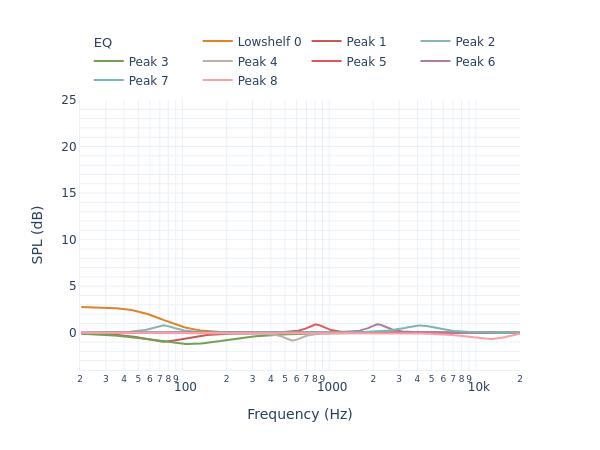
autoEQ
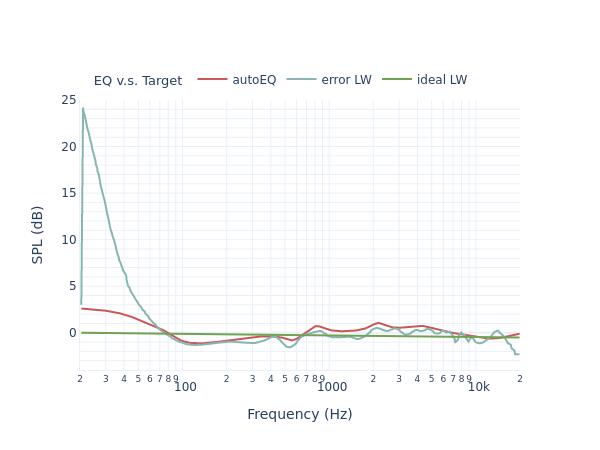
autoEQ v.s. target
|
Graphic EQ 15 bands
|
|
Set preamp gain to: -0.7dB.
|
| Type |
Freq |
Q |
Gain |
| PK |
25.0 |
2.14 |
0.5 |
| PK |
40.0 |
2.14 |
0.5 |
| PK |
63.0 |
2.14 |
0.5 |
| PK |
100.0 |
2.14 |
0.0 |
| PK |
160.0 |
2.14 |
-0.25 |
| PK |
250.0 |
2.14 |
0.0 |
| PK |
400.0 |
2.14 |
0.25 |
| PK |
630.0 |
2.14 |
0.5 |
| PK |
1000.0 |
2.14 |
0.5 |
| PK |
1600.0 |
2.14 |
0.25 |
| PK |
2500.0 |
2.14 |
0.25 |
| PK |
4000.0 |
2.14 |
0.25 |
| PK |
6300.0 |
2.14 |
0.25 |
| PK |
10000.0 |
2.14 |
-0.25 |
| PK |
16000.0 |
2.14 |
-0.5 |
|
Download
|
This EQ is designed for a 15 bands graphical EQ.
autoEQ
autoEQ v.s. target
|
Graphic EQ 31 bands
|
|
Set preamp gain to: -0.4dB.
|
| Type |
Freq |
Q |
Gain |
| PK |
20.0 |
4.32 |
0.0 |
| PK |
25.0 |
4.32 |
0.0 |
| PK |
31.0 |
4.32 |
0.0 |
| PK |
40.0 |
4.32 |
0.0 |
| PK |
50.0 |
4.32 |
0.0 |
| PK |
63.0 |
4.32 |
0.0 |
| PK |
80.0 |
4.32 |
0.0 |
| PK |
100.0 |
4.32 |
-0.25 |
| PK |
125.0 |
4.32 |
-0.25 |
| PK |
160.0 |
4.32 |
-0.25 |
| PK |
200.0 |
4.32 |
-0.25 |
| PK |
250.0 |
4.32 |
-0.25 |
| PK |
315.0 |
4.32 |
-0.25 |
| PK |
400.0 |
4.32 |
0.0 |
| PK |
500.0 |
4.32 |
-0.25 |
| PK |
630.0 |
4.32 |
0.0 |
| PK |
800.0 |
4.32 |
0.25 |
| PK |
1000.0 |
4.32 |
0.0 |
| PK |
1250.0 |
4.32 |
0.0 |
| PK |
1600.0 |
4.32 |
0.0 |
| PK |
2000.0 |
4.32 |
0.25 |
| PK |
2500.0 |
4.32 |
0.25 |
| PK |
3150.0 |
4.32 |
0.25 |
| PK |
4000.0 |
4.32 |
0.25 |
| PK |
5000.0 |
4.32 |
0.25 |
| PK |
6300.0 |
4.32 |
0.25 |
| PK |
8000.0 |
4.32 |
0.0 |
| PK |
10000.0 |
4.32 |
0.0 |
| PK |
12000.0 |
4.32 |
0.0 |
| PK |
16000.0 |
4.32 |
0.0 |
| PK |
20000.0 |
4.32 |
0.0 |
|
Download
|
This EQ is designed for a 31 bands graphical EQ.
autoEQ
autoEQ v.s. target
Histogram of errors

On Axis (fullrange)

Listening Window (fullrange)

Predicted In-Room Response (fullrange)
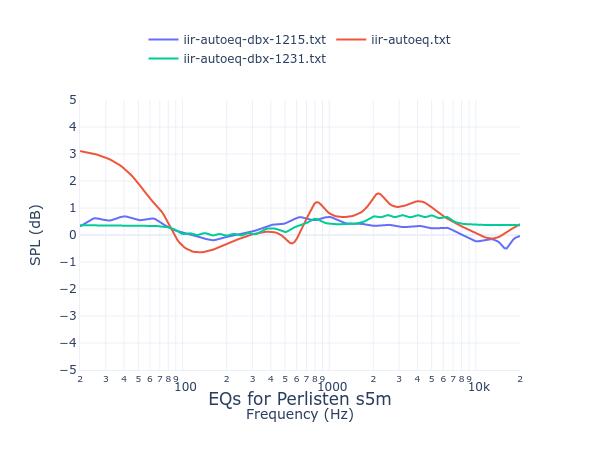
Comparison betweens various EQs
|


